

Introduction
Trading successfully in today’s fast-paced markets requires more than just intuition—it requires knowledge, strategy, and proven tools. Among these tools, candlestick patterns for successful trading stand out as one of the most reliable methods for predicting price movements. Whether you are trading stocks, forex, or cryptocurrencies, candlestick patterns help you decode market psychology and make informed decisions.
In this comprehensive guide, we will explore what candlestick patterns are, why they are essential, and which ones you must know in 2025 to improve your trading success. By the end of this article, you will understand how to apply these patterns to your strategy with confidence.
1. What Are Candlestick Patterns?
Candlestick patterns are visual charts used by traders to analyze the behavior of buyers and sellers in the market. Each candlestick represents price action during a specific period and shows four crucial data points:
- Open – the price at which the period started
- Close – the price at which the period ended
- High – the highest price during the period
- Low – the lowest price during the period
When analyzed in sequence, candlestick patterns for successful trading reveal potential shifts in momentum, reversals, and continuations. Traders often describe them as the “language of the market” because they tell a story about investor sentiment.
2. Why Candlestick Patterns Matter for Traders
Every trader wants a competitive edge. Candlestick patterns offer that advantage because they:
- Provide instant visual insights into market direction.
- Identify entry and exit points with high accuracy.
- Work across different assets—stocks, forex, commodities, and crypto.
- Adapt to multiple timeframes, from 1-minute charts to daily or weekly charts.
Power Keyword Used: Proven Strategies
For decades, candlestick patterns have remained among the most proven strategies in technical analysis. They are simple, practical, and effective when used properly.
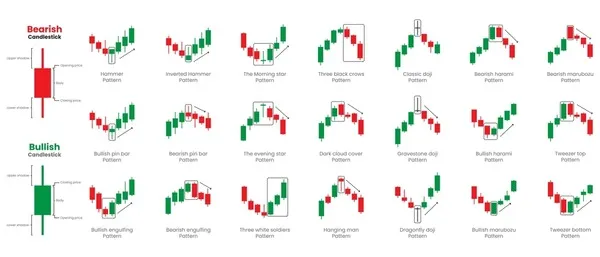
3. 8 Must-Know Candlestick Patterns for Successful Trading
3.1 The Doji
A Doji forms when the open and close prices are nearly identical. It represents indecision in the market.
- Bullish Scenario: After a strong downtrend, a Doji may signal a reversal.
- Bearish Scenario: At the top of an uptrend, it could indicate weakening buying pressure.
3.2 The Hammer
The Hammer has a small body and a long lower wick.
- Appears at the bottom of a downtrend.
- Indicates buyers stepping in after heavy selling pressure.
- Often followed by bullish price movement.
3.3 The Inverted Hammer
This pattern looks like a hammer but upside down.
- Appears after a downtrend.
- Suggests a potential bullish reversal if confirmed by the next candle.
3.4 Bullish Engulfing Pattern
A strong bullish candle completely engulfs the previous bearish candle.
- Shows overwhelming buying power.
- Often marks the beginning of an uptrend.
3.5 Bearish Engulfing Pattern
The opposite of the bullish engulfing.
- A large bearish candle engulfs a bullish one.
- Indicates sellers are dominating and a possible downtrend.
3.6 Morning Star
A three-candle formation signals a reversal.
- First candle: long bearish.
- Second candle: small-bodied (indecision).
- Third candle: strong bullish.
- Considered a reliable bullish reversal signal.
3.7 Evening Star
The bearish counterpart of the Morning Star.
- Indicates the end of an uptrend.
- Strong bearish confirmation if the third candle closes below half of the first candle.
3.8 Shooting Star
A small body with a long upper wick.
- Appears at the top of an uptrend.
- Signals that buyers tried to push higher, but sellers regained control.
4. How to Read Candlestick Patterns for Successful Trading
Reading candlestick patterns effectively requires attention to detail:
- Size of the Candle: Larger candles suggest stronger market momentum.
- Wick Lengths: Long wicks show rejection of certain price levels.
- Confirmation: Always wait for the next candle before entering a trade.
- Volume: Higher volume strengthens the signal of the pattern.
Example: If you spot a Hammer with high trading volume, the bullish reversal is more reliable.
5. Combining Candlestick Patterns with Indicators
While candlestick patterns are powerful on their own, combining them with technical indicators increases accuracy.
- RSI (Relative Strength Index): Confirms overbought or oversold conditions.
- MACD (Moving Average Convergence Divergence): Shows trend strength and momentum.
- Moving Averages: Help confirm long-term direction.
For example:
- A Bullish Engulfing pattern + RSI below 30 = strong buy signal.
- A Shooting Star + RSI above 70 = strong sell signal.
6. Common Mistakes Traders Make
Even though candlestick patterns for successful trading are reliable, many traders misuse them. Avoid these mistakes:
- Entering trades without confirmation from the next candle.
- Using patterns in isolation without considering the overall trend.
- Trading every small pattern on lower timeframes.
- Ignoring risk management and stop-loss levels.
7. Benefits of Using Candlestick Patterns
- Quick Analysis: You don’t need complex tools to spot them.
- Universal Application: They work in stock, forex, and crypto markets.
- Psychological Edge: Patterns show real-time market sentiment.
- Improved Timing: Helps decide the right entry and exit points.
- Risk Control: Patterns guide where to place stop-loss orders.
8. Advanced Tips for Mastering Candlestick Patterns
To maximize success, follow these advanced practices:
- Trade in the direction of the larger trend.
- Always use stop-loss orders.
- Backtest your strategies before using them in live trading.
- Keep a trading journal to track performance.
- Avoid emotional trading; rely on analysis.
Conclusion
Mastering candlestick patterns for successful trading is a timeless skill. These patterns allow traders to read the market’s language and make confident decisions. By combining them with other technical indicators and maintaining discipline, traders can gain a strong edge in today’s volatile markets.
In 2025, whether you are a beginner or an advanced trader, understanding candlestick patterns is no longer optional—it is essential. Start practicing these patterns, refine your strategy, and trade smarter, not harder.

