

Introduction
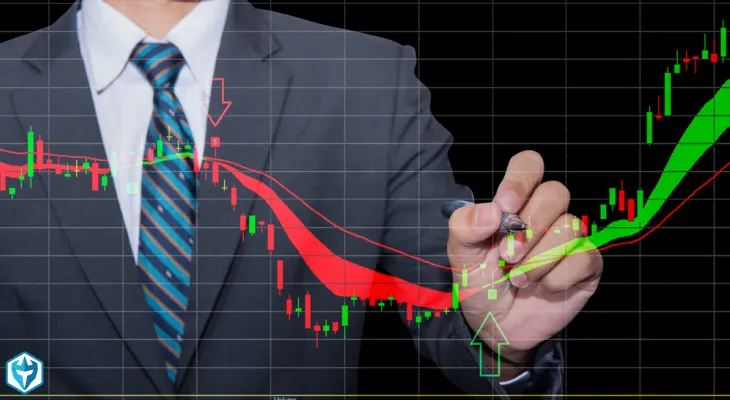
Trading in today’s fast-paced financial markets requires more than just luck. Successful traders rely on Technical Analysis for Successful Trading to make calculated decisions. By studying charts, price movements, and market trends, technical analysis empowers traders to predict potential opportunities and manage risks effectively.
Whether you are dealing in stocks, forex, or cryptocurrencies, technical analysis gives you the roadmap to understand when to buy, hold, or sell. This article will serve as a complete guide, helping you unlock the true potential of trading with technical analysis.
What is Technical Analysis?
Technical Analysis for Successful Trading is the study of past market data—primarily price and volume—to forecast future price movements. Unlike fundamental analysis, which focuses on economic data and company performance, technical analysis assumes that “the market discounts everything.”
It means all known information is already reflected in the price, so traders only need to study patterns and trends to make smart decisions.
Why Use Technical Analysis for Successful Trading?
Here are some reasons why technical analysis is crucial for traders:
- Identifies market trends: Helps traders follow bullish or bearish moves.
- Assists in timing trades: Entry and exit points become clearer.
- Provides visual clarity: Charts simplify complex market data.
- Applies to multiple markets: Useful for stocks, forex, crypto, and commodities.
- Works with any timeframe: From scalping to long-term investing.
Using technical analysis is a powerful strategy that transforms trading from guesswork into a calculated approach.
Core Principles of Technical Analysis
1. Market Discounts Everything
Prices already reflect news, earnings, economic conditions, and emotions.
2. Prices Move in Trends
Markets generally follow uptrends, downtrends, or sideways movements.
3. History Repeats Itself
Chart patterns like head & shoulders, double tops, or triangles often reappear because of human psychology.

Essential Tools for Technical Analysis
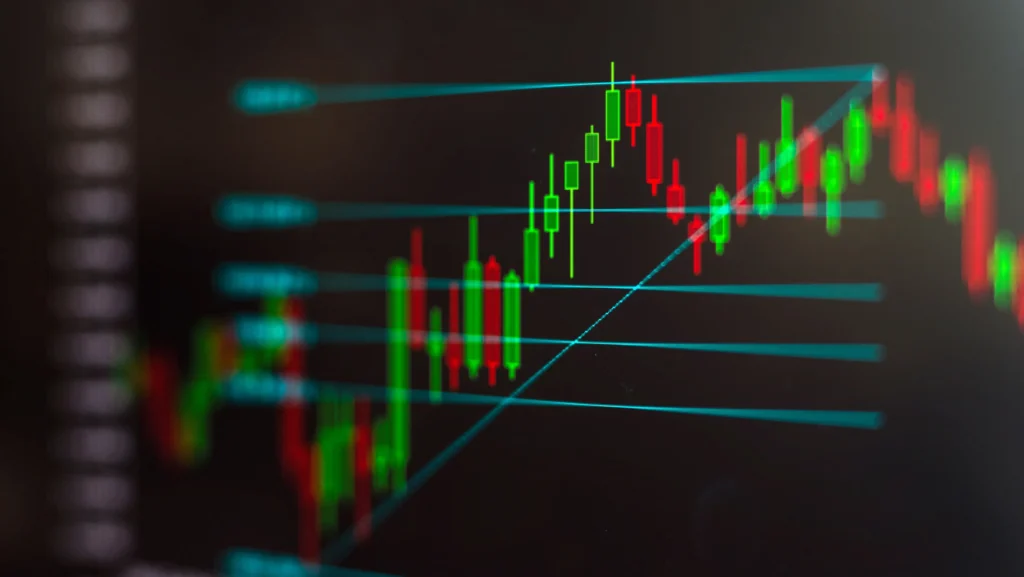
1. Price Charts
Candlestick, bar, and line charts provide visual representation of price movements.
2. Technical Indicators
- Moving Averages (MA): Identify overall trend.
- Relative Strength Index (RSI): Measures overbought/oversold conditions.
- MACD (Moving Average Convergence Divergence): Detects trend strength and reversals.
- Bollinger Bands: Show volatility levels.
3. Volume Analysis
Helps confirm the strength of a price move.
Popular Chart Patterns in Trading
1. Continuation Patterns
- Triangles (ascending, descending, symmetrical)
- Flags and Pennants
2. Reversal Patterns
- Head and Shoulders
- Double Tops and Bottoms
- Cup and Handle
Each pattern provides signals about potential future price direction.
Timeframes in Technical Analysis
- Scalping: Seconds to minutes
- Day Trading: Single-day trades
- Swing Trading: Days to weeks
- Position Trading: Weeks to months
Traders must align their strategy with the right timeframe for consistent results.
Risk Management in Technical Trading
Even with the best analysis, trading carries risk. Smart traders always:
- Use stop-loss orders
- Manage leverage carefully
- Diversify positions
- Avoid emotional trading
This ensures that one bad trade does not wipe out profits from multiple successful trades.
Technical Analysis Across Markets
1. Stock Market Trading
Technical analysis is widely used for identifying undervalued or overbought stocks.
2. Forex Trading
Charts help track currency pairs and global news impact.
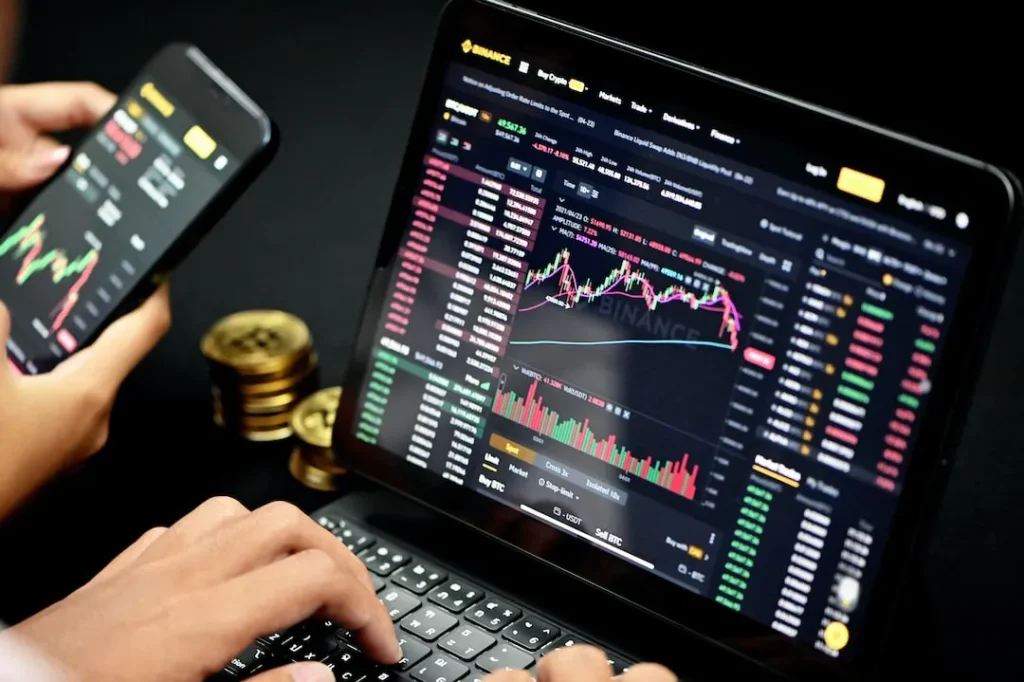
3. Cryptocurrency Trading
Due to high volatility, technical analysis plays a major role in predicting crypto price swings.
4. Commodity Trading
Helps traders anticipate moves in gold, oil, and agricultural products.
Combining Technical & Fundamental Analysis
While technical analysis helps with timing, fundamental analysis provides the “why” behind market movements. A balanced trader uses both for maximum success.
Common Mistakes in Technical Analysis
- Overusing indicators (“analysis paralysis”)
- Ignoring risk management
- Misinterpreting patterns
- Trading without a plan
Avoiding these mistakes separates profitable traders from those who lose money.
Practical Steps to Start Using Technical Analysis
- Choose a reliable trading platform.
- Learn basic chart reading.
- Practice with free demo accounts.
- Master 2–3 indicators instead of all.
- Keep a trading journal to track progress.
Future of Technical Analysis in Trading
With the rise of AI, machine learning, and algorithmic trading, technical analysis will continue to evolve. Automated bots are already using indicators to place trades within seconds. However, human intuition combined with technical tools remains unbeatable.
Conclusion
In the world of trading, knowledge is power. By applying Technical Analysis for Successful Trading, traders can turn uncertainty into opportunity. From chart patterns to risk management, technical analysis equips you with the strategies needed for long-term success.
Remember, consistency and discipline matter more than quick profits. Master technical analysis, and you will be prepared to make smarter, more confident trading decisions across any market.


